Technical analysis helps investors make informed trading decisions by studying price movements and patterns. This guide covers the essential elements of Stock Chart Technical Analysis you need to start analyzing stock markets effectively.
Understanding Chart Basics
Types of Charts
- Candlestick charts: Show open, high, low, and close prices in a single bar
- Line charts: Display closing prices connected by lines
- Bar charts: Similar to candlesticks but with simpler vertical bars
Stock Chart Technical Analysis: Time frames
- Daily charts: Most common for general analysis
- Weekly/Monthly: Better for long-term trends
- Intraday: Used for short-term trading
Reading Price and Volume
- Price scale on right side shows current values
- Time scale on bottom shows periods
- Volume bars appear at bottom of chart
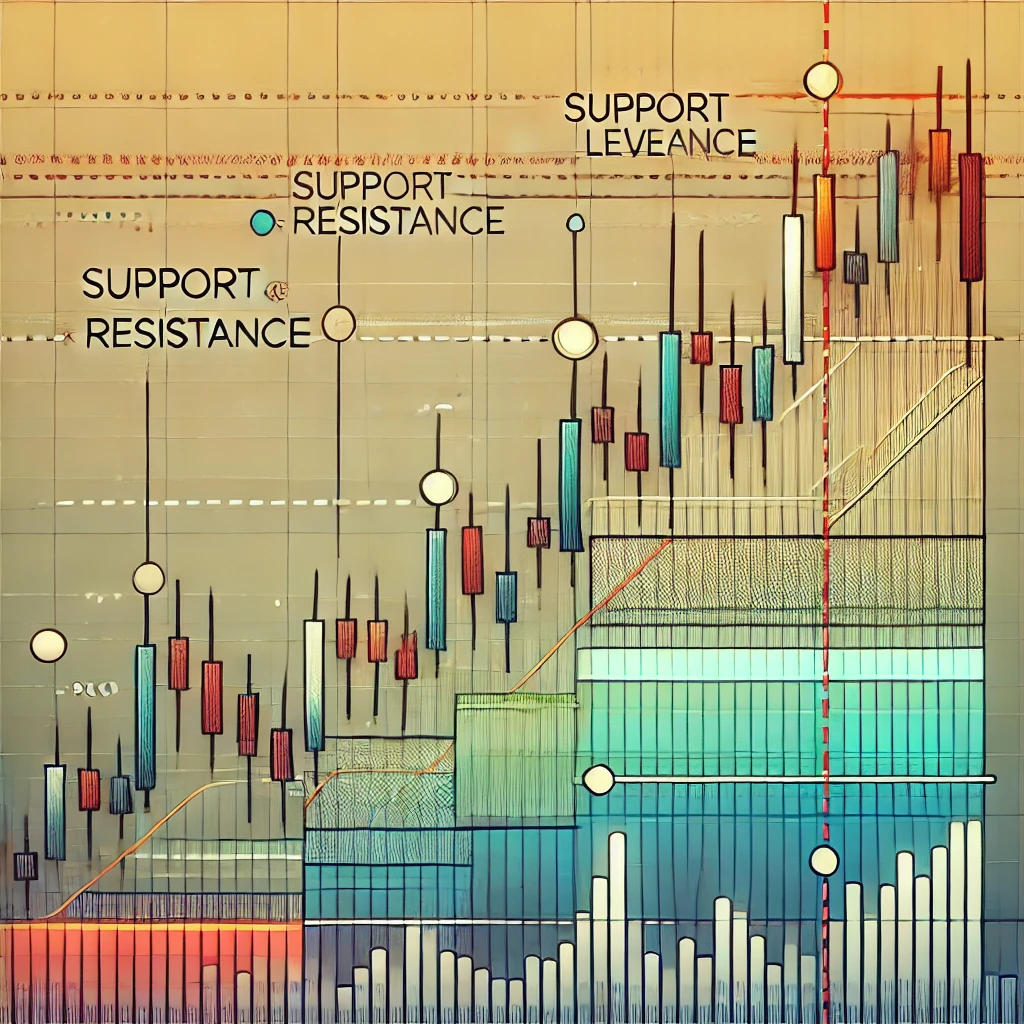
Key Support and Resistance Levels

Support Zones
- Areas where buying pressure exceeds selling
- Often form at previous low points
- Breaking support suggests trend change
Resistance Points
- Price levels where selling exceeds buying
- Form at previous high points
- Breaking resistance indicates strength
Trendlines

- Connect series of highs or lows
- Steeper lines suggest stronger trends
- Multiple touches increase significance
Essential Chart Patterns : Stock Chart Technical Analysis
Reversal Patterns
- Head and shoulders: Three peaks with middle highest
- Double tops/bottoms: Two peaks/troughs at similar levels
- Price often moves significantly after completion
Continuation Patterns
- Triangles: Converging trendlines showing consolidation
- Flags: Brief pauses in strong trends
- Rectangles: Trading ranges between support/resistance
Gap Patterns
- Breakaway gaps: Start of new trends
- Continuation gaps: During strong trends
- Exhaustion gaps: Near trend ends
Moving Averages and Trends
Moving Average Types
- Simple: Equal weight to all prices
- Exponential: More weight to recent prices
- Common periods: 20, 50, 200 days
Trend Identification
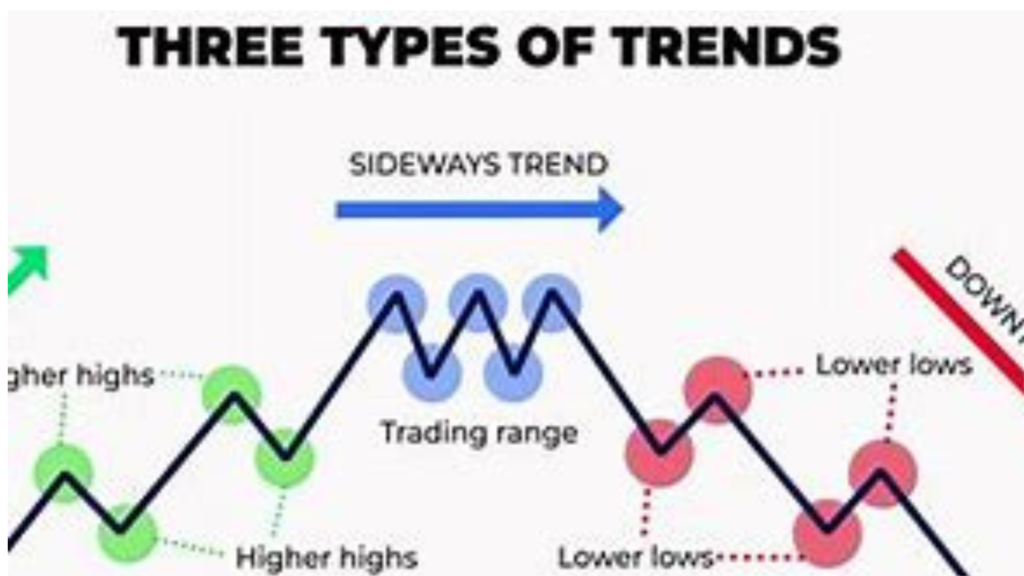
- Uptrend: Higher highs and higher lows
- Downtrend: Lower highs and lower lows
- Sideways: No clear direction
Moving Average Crossovers
- Golden cross: Short-term crosses above long-term
- Death cross: Short-term crosses below long-term
- Used for trend confirmation
Volume Analysis
Volume-Price Relationships
- Rising prices with rising volume: Strong trend
- Rising prices with falling volume: Potential weakness
- High volume at support/resistance: Important levels
Volume Indicators
- On-Balance Volume (OBV): Cumulative volume measure
- Volume Moving Average: Smoothed volume trend
- Volume Rate of Change: Volume momentum
Volume Confirmation
- High volume on breakouts: More reliable signals
- Low volume during consolidation: Normal behavior
- Volume spikes: Potential trend exhaustion
Technical Indicators
Momentum Indicators
- RSI (Relative Strength Index) measures price momentum on a scale of 0-100
- MACD (Moving Average Convergence Divergence) shows relationship between two moving averages
- Values above 70 on RSI often indicate overbought conditions
- Values below 30 on RSI often indicate oversold conditions
Volatility Indicators
- Bollinger Bands consist of three lines: upper, middle, and lower bands
- Wider bands indicate higher volatility
- Price reaching bands often signals potential reversal
- Middle band serves as dynamic support/resistance
Trend Indicators
- ADX (Average Directional Index) measures trend strength
- ADX readings above 25 indicate strong trends
- ADX below 20 suggests weak or no trend
- Can help avoid false signals in sideways markets
Summary
Key Takeaways
- Technical indicators work best when used in combination
- No single indicator guarantees success
- Price action should confirm indicator signals
- Always use stop-loss orders regardless of indicators
Best Practices
- Start with 2-3 basic indicators
- Confirm signals across multiple timeframes
- Keep charts clean and simple
- Document your analysis and results
Common Mistakes
- Over-relying on single indicators
- Ignoring price action
- Adding too many indicators
- Trading against major trends


Pingback: The Power of Volume Analysis:"7 hidden Benefits for Trading"