Introduction to Fibonacci Trading
Fibonacci Trading is the unique enterprising strategy of traders to identify the potential price movements in financial markets. It is based on the Fibonacci sequence, which is a series of numbers in which each number is the sum of the two preceding numbers.
This sequence is named for the Italian mathematician Leonardo Fibonacci, who brought it to the Western world in his book “Liber Abaci,” published in 1202. It has innovative mathematical properties and can appear in different things by nature, which can be such an influential weapon in the hands of traders.
Fibonacci retracement levels are used by traders to find possible support and resistance levels. These levels are derived from Fibonacci ratios like 23.6%, 38.2%, and 61.8%.
By applying these ratios to price charts, traders can make informed decisions about entry and exit points. This technique is valuable for both novice and experienced traders, as it helps them navigate the complexities of the market and make more strategic trading decisions.
What is Fibonacci Retracement?
Fibonacci retracement is a technical analysis tool used by traders to identify potential support and resistance levels in financial markets. It is based on the Fibonacci sequence, a series of numbers where each number is the sum of the two preceding ones.
Important key Fibonacci retracement levels and its significance
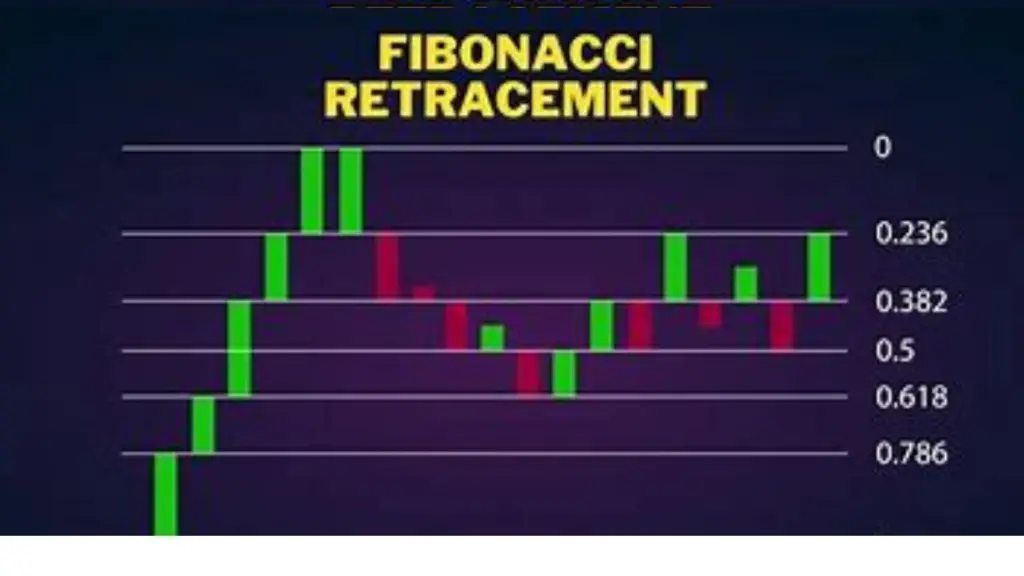
- 23.6% Level: This is the most shallow retracement level. It shows a slight pullback and signals that the trend remains strong. A bounce at this level is widely expected among traders as the continuation of the trend.
- 38.2% Level: This level signifies a moderate retrace. Traders use it to find a healthy correction in a trend. If the bounce from here, we can expect for the trend to keep going.
- 50% Level: The 50% level is not a Fibonacci ratio, but it is commonly used in technical analysis. Disclaimer: This data is information obtained from the web & we do not own any rights. A reversal from this level is an indicator of firm support/ resistance.
- 61.8% Level: This is one of the most important Fibonacci retracement levels. It represents a deep retracement and suggests a potential reversal of the trend. A bounce from this level indicates strong support or resistance and is often used to confirm the trend’s continuation.
- 78.6% Level: This level represents a very deep retracement and suggests a potential reversal of the trend. A bounce from this level indicates strong support or resistance and is often used to confirm the trend’s continuation.
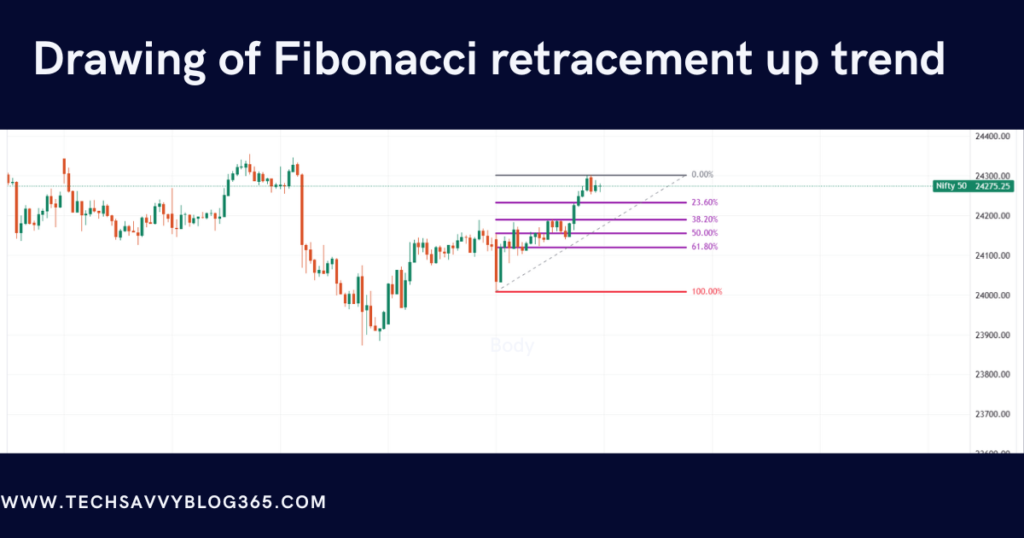
By understanding and applying these key retracement levels, traders can make more informed decisions about entry and exit points, stop-loss levels, and price targets. This helps them navigate market trends with greater confidence and improve their trading strategies.
Fibonacci Extensions and important key extension levels
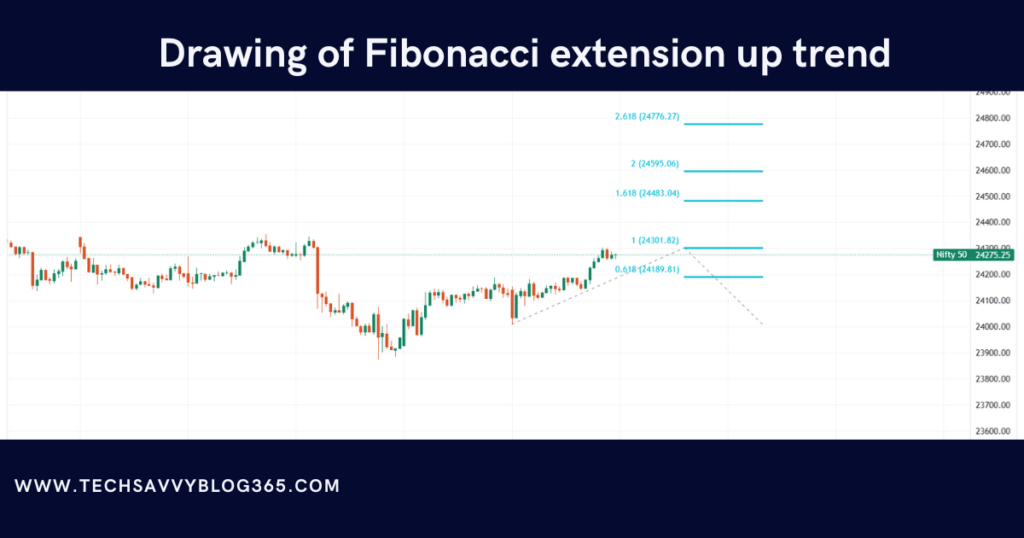
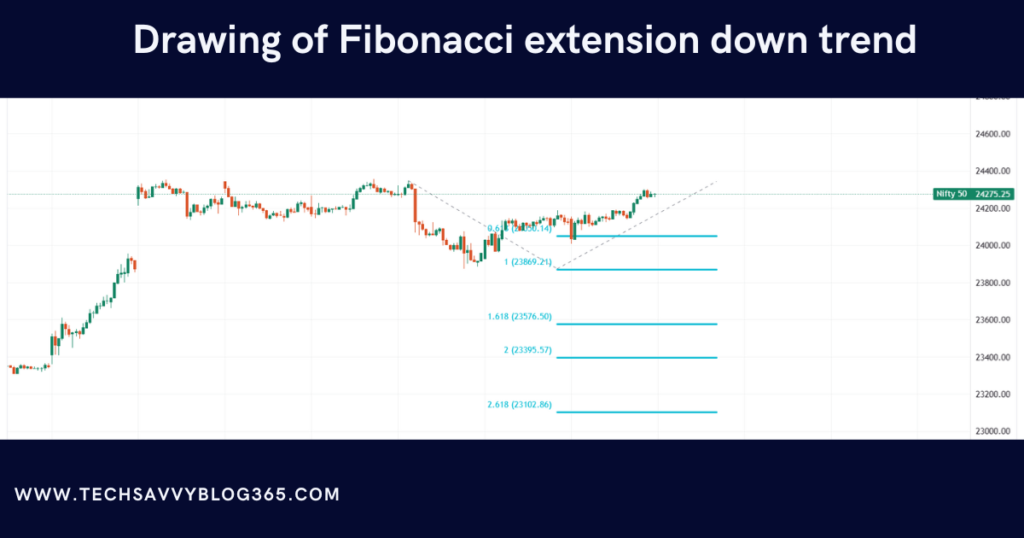
Fibonacci extensions and very strong weapon. They are just extensions to the traditional Fibonacci retracement levels above 100% where significant FR levels like 127.2%, 161.8%, and 261.8% extend up to the price movement of an asset.
To apply for Fibonacci extensions configurable, traders will find their prominent high at the swing, retracement, and swing low, and apply their short form of Fibonacci extension above the retracement points to know the extension areas on what may happen when the price goes after pull-back.
Fibonacci extensions are facilitating goals and good trading decisions. Extension levels can effectively improve trading strategies comprehensively through the evaluation and understanding of these extensions.
Fibonacci divergence
It is a part of Fibonacci trading that establishes possible reversals in trends. When prices of an asset move in the direction opposite to that of the indicator, which may generally be the Relative Strength Index, then it is called Fibonacci Divergence. Divergence can help a trader assess the market crowd’s anticipation of how the price is going to change. Further, it augments the mean contacts with the ideal world of the emergence of superior forms of trading strategies brought out by sensitive traders.
How do you recognize trends with Fibonacci retracement on stock market analysis?
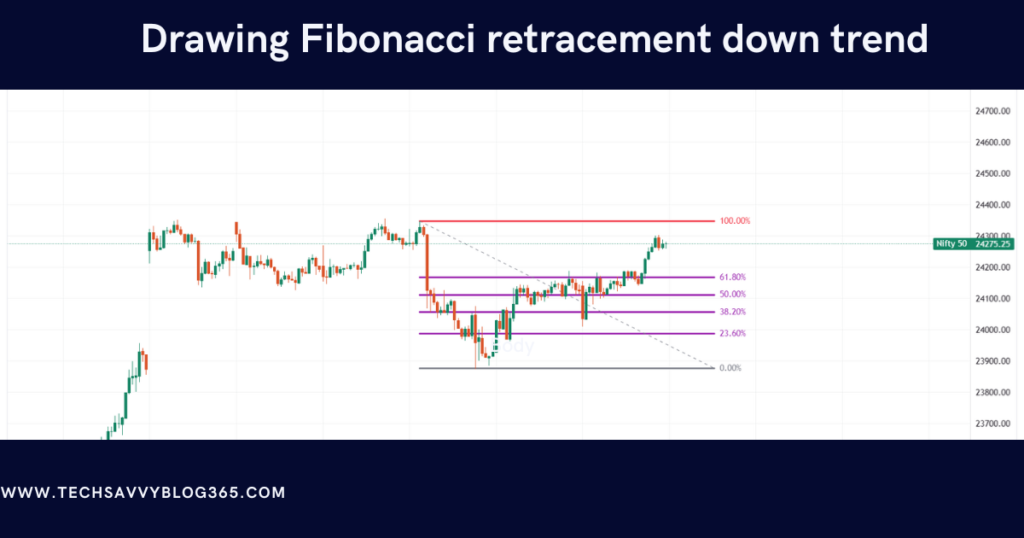
You start first by determining the trend of the market up or down and then apply Fibonacci levels of retracement such as 23.6%, 38.2%, 50%, or 61.8% on the price chart. These levels above or below can generally provide indications of possible retracement zones in the price where support or resistance would be traced. In this way, traders can increase their strategies by knowing what the wise decision retracement level means.
Next, they arrange horizontal lines across a price chart on these important levels to forecast where the price may reverse direction; for example, a stock may pull back to one of these levels during its upward movement before it continues going on. Conversely, during a downward trend, the price may retrace to one of these levels before continuing on down.
Indeed, this retracement helps traders determine entry and exit points for trades, stop loss levels, and target prices. Hence, those who understand and apply it will have a better chance of seeing market trends and improving their trading strategy.
Advantages of Fibonacci Trading
Discussing the advantages of incorporating Fibonacci trading into your strategy.
Using Fibonacci in trading has several advantages. It helps one to find points of support and resistance to build a trend setup. It enables one to be fairly accurate in determining entry or exit points while trading using a retracement or extension level.
This makes Fibonacci trading applicable to stocks, foreign exchange, commodities, and other markets. This technique is quite easy to use and can make any trade, from beginner to expert. Overall, it benefits decision-making and maximizing successful trades.
Tips for Effective Fibonacci Trading
Best Practices for Combining Fibonacci Trading with Other Tools
On the best way to integrate Fibonacci trading with other tools, Fibonacci retracements always shine best when combined with other tools. Trendlines will show the direction and strength of a trend, while moving averages help identify dynamic support and resistance when approaching the key Fibonacci levels.
These can also be coupled with the use of RSI to measure momentum, thus overbought-and-oversold signals near the zones can indicate going into a strong position. Patterns like doji’s or engulfing candles authenticate the possible reversal.
Always cross-check your analysis over multiple timeframes to make sure that it’s valid. Remember, because trading thrives on synergy, no tool ever works alone. Put this wisdom together and you will develop a sharper edge.
How Fibonacci Trading Improves Analysis and Decision-Making in Markets
Fibonacci trading will essentially allow you to uncover support and resistance levels correlated with certain retracement percentages- like 38.2%, 50.0%, and 61.8%- as their occurrence is often found at turning points for the market, inferring movement of price.
For example, one could use Fibonacci in combination with other indicators like moving averages or RSI which give an excellent confirmation of trend and entry point. Great tool for setting real targets and stop loss levels, avoiding emotional decisions.
Definitely, a structured way to incorporate Fibonacci into the planning strategy for market trend analysis and apply it for better confidence and accuracy in trades. Such a powerful way to be ahead in these markets as they develop!
Common Pitfalls and Misconceptions
Highlighting common mistakes traders make with Fibonacci trading.
Exclusively relying on Fibonacci levels is one mistake in trading. There are other mistakes like misdiagnosing the trend and leaving out the actual context of the market itself. Generally, these mistakes tend to lead to over-trading on Fibonacci retracement and cost the traders poor decisions. It is better to combine Fibonacci trading with other mechanism analyses for accurate and effective functionalities.
Tips for avoiding these pitfalls and using Fibonacci trading effectively.
Fibonacci trading becomes easier with confirmation of other indicators, recognition of real trend directions, and Bitcoin’s broad setting. Thereupon, he is advised against depending on Fibonacci levels alone. These will definitely help the traders improve their decisions and boost their strategies.
Conclusion
1. Overview of Core Subjects: Fibonacci trading entails trading according to Fibonacci retracement and extension levels to find entry and exit points. This process identifies possible areas of support and resistance based on the prediction of price movements at those levels as far as the whole strategy is concerned. It applies practically in any market; hence it is something that every novice and expert trader should have in their arsenal.
2. Recommendation to Adopt: Adoption of this phenomenon into the strategy of your company will really help one in market forecasting and decision-making. You would know more about what goes on in your trade, and thereby increase your chances of success with a wider and better understanding of the trends around the market.
Additional Resources
- Suggested Reading, Articles, and Web-based Courses – If you are planning to delve deeper into Fibonacci trading, read something like Fibonacci Trading: How to Master the Time and Price Advantage by Carolyn Boroden and Secrets on Fibonacci Trading by Frank Miller. Articles like “Fibonacci Techniques for Profitable Trading” in Investopedia and online courses on sites like Udemy4 are helpful as well.
- Useful instruments and platforms: Enhance your Fibonacci trading journey with tools such as the Fibonacci Calculator on Investing.com, and Trading View. Such resources present advanced charting and automated trading features for supported trading strategies.
Disclaimer: Trading involves risk. This content is for educational purposes only and should not be considered as financial advice.


