Introduction
Table of Contents
TogglePicture the bustling, buzzing atmosphere right as you stand on the brink of a marketplace. Traders are on standby, glued to their screens for the right opportunity. Being able to identify bullish patterns could be the difference between making and losing money when trading.
In this article, we will outline five of the most important bullish patterns that every trader needs to know to feel empowered in their trading on the markets.
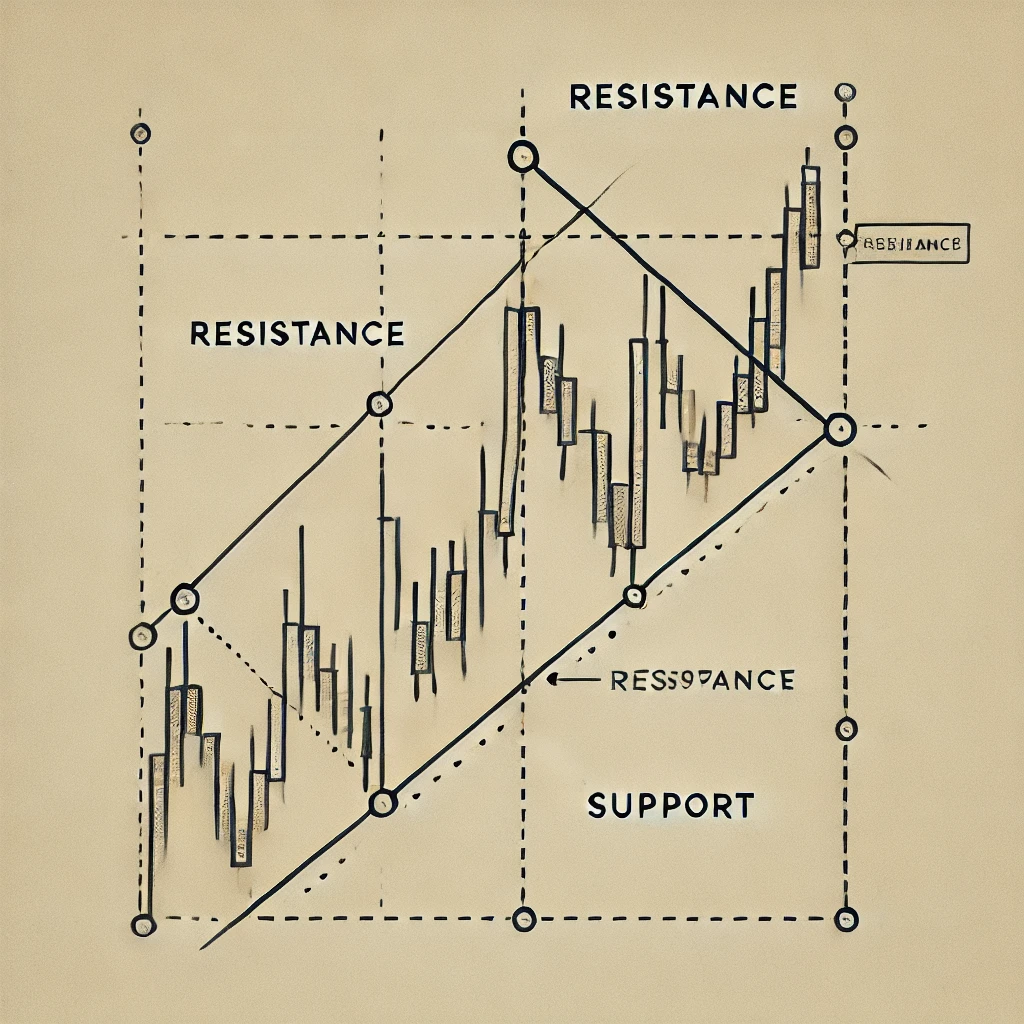
The bullish patterns below help to understand the BULLISH patterns.
Know your bullish pattern (what does that even mean) before we get into individual patterns A bullish pattern suggests a potential price appreciation of a security. These patterns can help traders buy when to go and hold a position.
Why Technical Analysis Really Matters
The backbone of finding bullish patterns is technical analysis. Historical price movements and trading volumes form an insight into traders and what would be the future price movement. Hence, this approach depends on charts and patterns more than essential information like profit or economic indications.
The 5 Key Bullish Patterns
1. The Cup and Handle

The Cup and Handle Pattern The cup and the handle is a classic bullish continuation pattern. This pattern is teacup in shape and shows consolidation then a breakout.
The “cup” is formed after a decline, followed by a rounding bottom and rise back to the prior peak. The handle is essentially a short-term consolidation period before the breakout.
Trade Strategy: Traders will typically buy a position upon the price breaking above the handle resistance level, expecting the upward trend to continue.
2. The Ascending Triangle

The Ascending Triangle is a bullish continuation pattern that signals an upcoming breakout.
Pattern: This pattern is created when the price has a sequence of higher lows while hitting resistance at a constant point, allowing the two to form an avatar of a triangle.
Trading Strategy: A breakout above the resistance level (especially with increased volume) indicates that traders believe the price action will continue in the same direction.
3. The Bullish Flag
Bullish Flag — a short-term continuation pattern which appears after a high price movement.
Formation: Following a sharp upward movement, the price rallies within a narrow range forming a flag look. Then comes a breakout in the direction of the trend that had previously been established.
How to Trade: Traders often buy on the breakout above the upper boundary of the flag, looking for a continuation of the previous trend.
4. The Double Bottom
The Double Bottom is a reversal pattern that signals the potential shift in the direction of the trend.
Formation: Price reaches a support area, bounces back up and then retests the same support level before going back up again.
What Is the Trading Strategy Here: Once the price breaks above the resistance at that level, traders seem to pile into a position signaling a reversal back to an uptrend.
5. The Head and Shoulders Inverse
The Inverse Head and Shoulders Pattern is a reversal pattern that indicates the end of a downtrend and the start of an uptrend.
Structure: It has 3 lowers – a lower low (head) between two higher lows (shoulders).
How Traders Trade: Usually a trader will set the position when the top surpasses through the neckline which is where the resistance level joins both tops of the shoulder.
Conclusion
Knowing these bullish patterns can help you become a better trader. Traders can increase their probability of success in the markets by being aware of and knowing these patterns. Keep in mind that while these patterns can be helpful, they should not be relied upon exclusively and always be used alongside other analysis methods and risk management principles.
Well in trading just like in life, being prepared and aware is the name of the game.
Disclaimer: Trading involves risk. This content is for educational purposes only and should not be considered as financial advice.


